Plots and statistics comparing Fitness Scores and Expression Data from Church and Young Labs can be found [here]
Figure S1. Distribution of slow growing yeast strains by functional category.
The percent of genes in each major functional category [MIPS](Note: This opens a window to a different site)
relative to the whole genome is plotted along the x-axis in blue. The percent
of genes in each major functional category relative to the total number of
slow growing strains is plotted along the x-axis in yellow.
| average ratio after ~ 10 generations | approximate % of wildtype growth |
|---|---|
| 3X | 80% |
| 10X | 65% |
| 20X | 50% |
| Condition | Measured Genes | Significantly Up-Regulated | Significantly Down-Regulated | % with Significant Upregulation & Significant for Fitness Defect | % with Significant Downregulation & Significant for Fitness Defect |
|---|---|---|---|---|---|
| Galactose | 4682 | 99 | 84 | 6.06 | 0.00 |
| Alkali | 4711 | 434 | 464 | 3.00 | 3.23 |
| 1M NaCl | 4711 | 679 | 1047 | 0.88 | 1.15 |
| 1.5M Sorbitol | 4711 | 588 | 1024 | 0.34 | 0.0 |
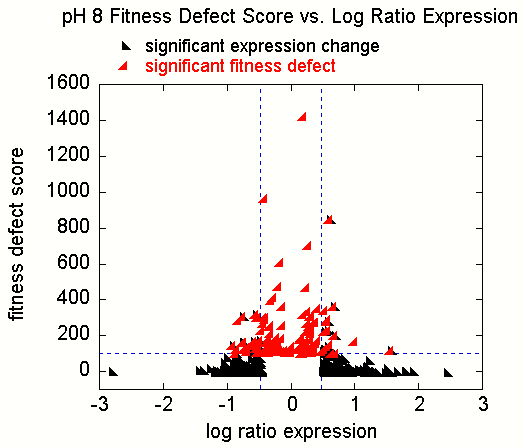 |
Figure 4c: Comparison of expression and fitness profiling data for pH 8. If a gene exhibits a significant increase in expression and is required to be expressed for survival in that condition, the corresponding deletion strain should also exhibit a decrease in fitness. Accordingly, (and for the sake of clarity) only those genes designated as sensitive by the fitness defect score were plotted. Red triangles represent genes with significant fitness defect scores (above the horizontal blue line) plotted as a function of their corresponding log ratio expression values. Black triangles represent genes with significant log ratio expression (outside of the two vertical blue lines) plotted with their corresponding fitness defect scores. The value of the fitness defect scores plotted is the minimum score from two experiments. In the galactose case, 6.1 % of the genes significantly up regulated also exhibited a significant decrease in fitness, while only 3.0 %, 0.88% and 0.34% of the genes significantly up regulated also exhibited a significant decrease in fitness for pH 8.0, 1M NaCl and 1.5M sorbitol, respectively. See table above.